


 31 / 324

VAKIFBANK
ANNUAL REPORT 2014
31
In May 2014, the uncertainties in domestic and
international markets diminished to some extent,
risk premium indicators showed some recovery and
market interest rates began to decline. In light of these
developments, the CBT decided to lower its policy interest
rate for the first time in 2014 at the MPC meeting in
May. The CBT cut the one-week repo rate, referred to
as policy interest rate, which it had raised sharply at the
intermediary meeting on January 28, from 10% to 9.5%.
Expecting that inflation peaked in May, the CBT cut the
policy interest rate by 75 basis points at its meeting in
June following a comment pointing to a considerable drop
in inflation starting in June. On the other hand, despite
the policy rate cut, making no change in the interest rate
corridor was an indication of the CBT’s preference for
sustaining the existing tight monetary policy. While the
CBT reduced the lower band of the interest rate corridor
and the policy interest rate by 50 basis points at its July
meeting, it did not change the upper band of the interest
rate corridor. This enabled the CBT to keep the interest
rates higher in the market by limiting the liquidity it was
pumping via the one-week repo rate, maintaining a tight
monetary policy in case of an unprecedented development
in the economy. In August, the CBT kept the policy rate and
the lower band of the interest rate at the same level while
it reduced the upper band by 75 basis points.
Thanks to both the base effect and declining commodity
prices, inflation is expected to go down starting in the first
quarter of 2015. In this scenario, the CBT is also expected to
lower interest rates starting from the first quarter of 2015.
On the other hand, the monetary policy to be followed in
2015 by the Fed, which is widely anticipated to start raising
interest rates as soon as at the second quarter of 2015, will
continue to affect capital inflows into developing countries.
The Fed’s decision on hiking interest rates is regarded as
one of the key factors influencing the CBT’s policies.
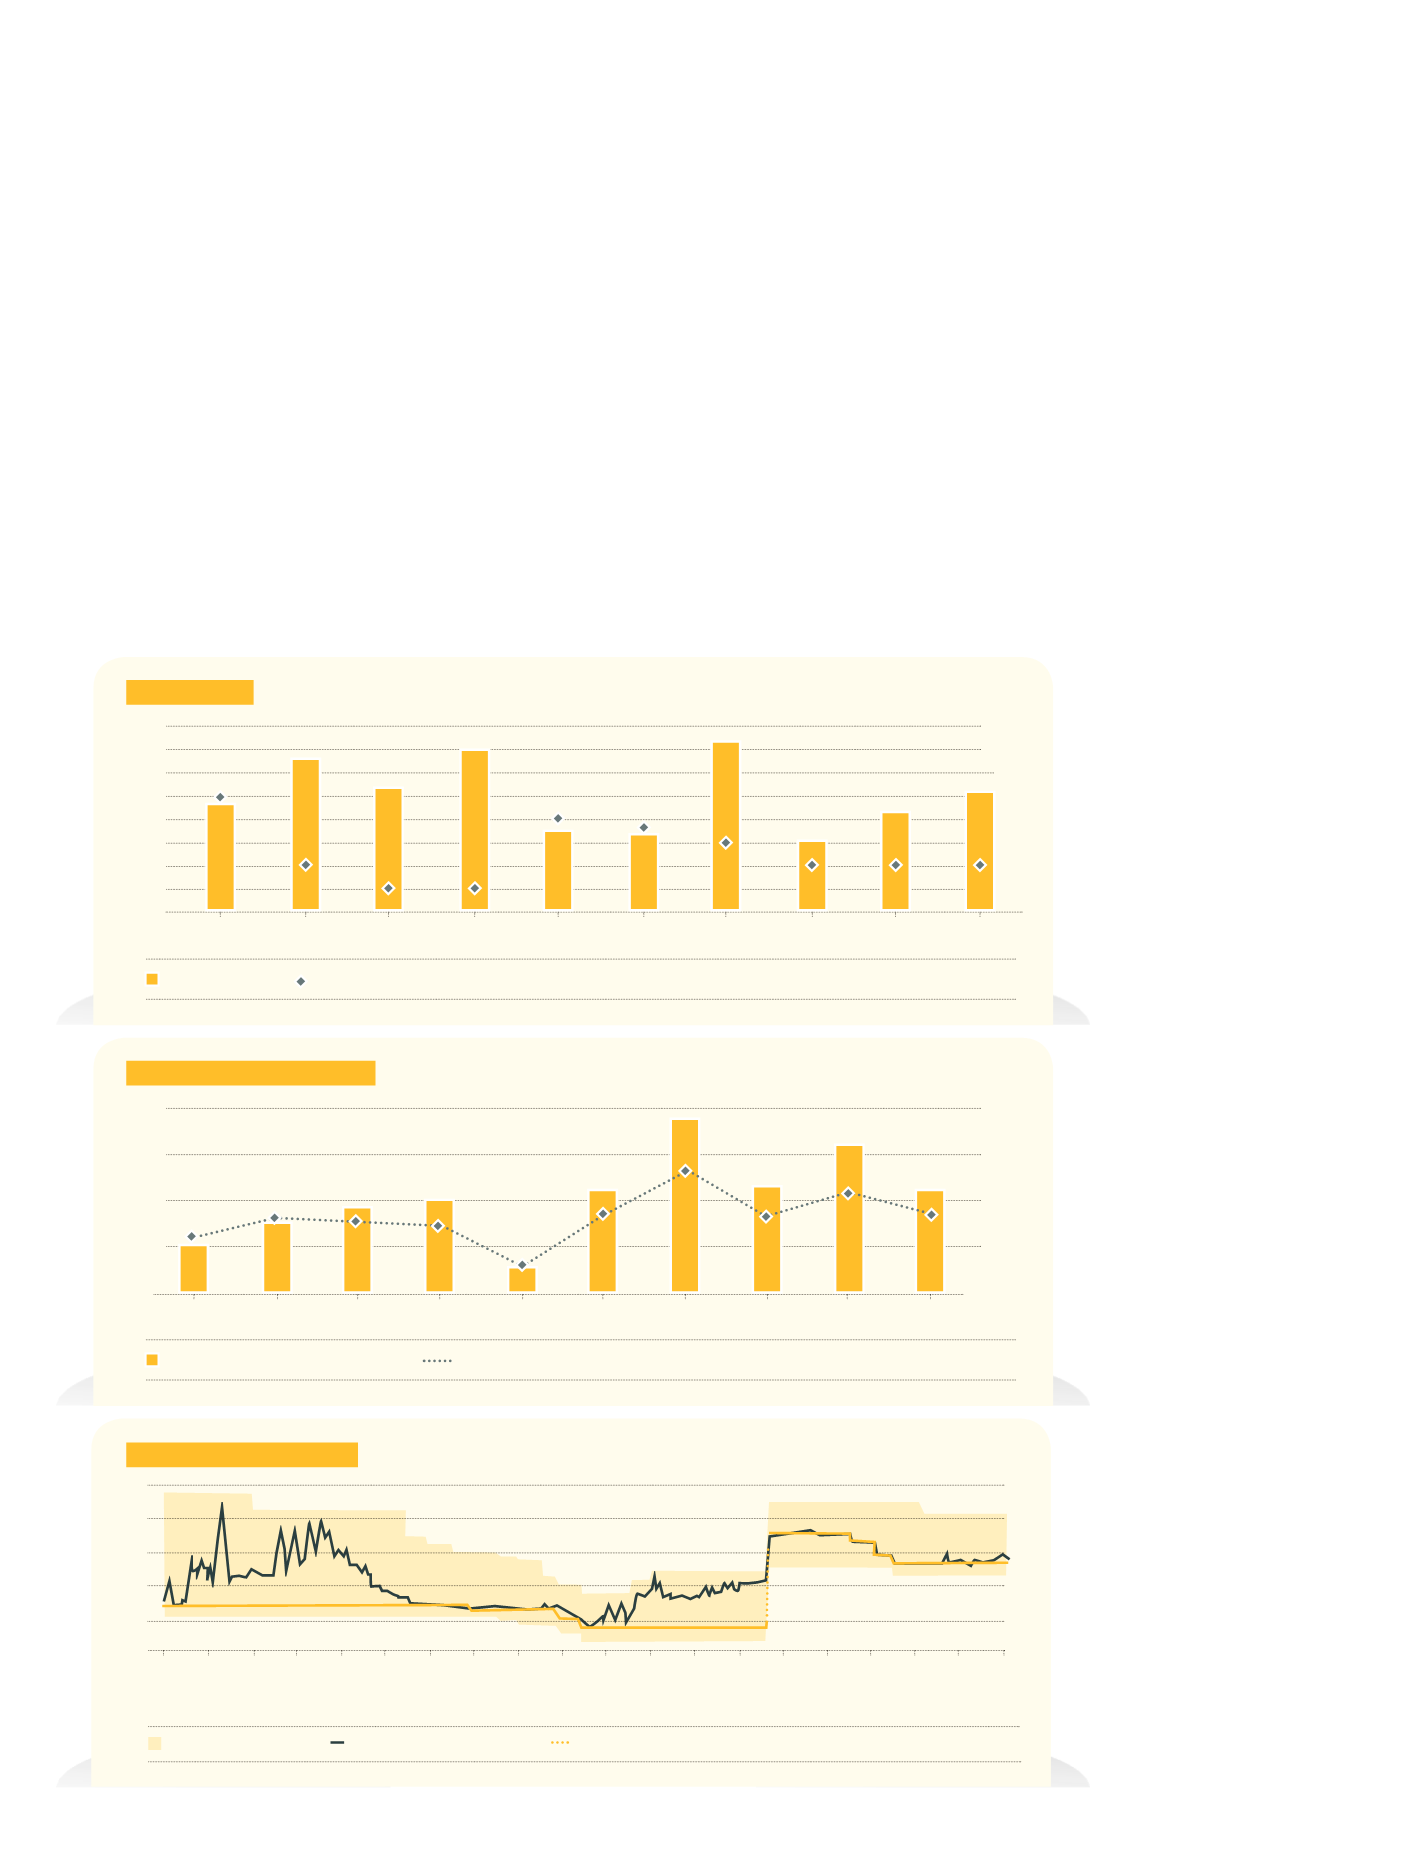
CURRENT ACCOUNT DEFICIT
Current Account Deficit (% GDP, right axis)
Current Account Deficit (annual, billion US$, left axis)
Source: CBT
80
15
60
10
40
5
20
0
0
2005
2006
2007
2008
2009
2010
2011
2012
2013
2014*
*Current Account Deficit/GDP rate Q3 data
CBT INTEREST RATES (%)
One-Week Repo Auction
Lending Borrowing
Average Cost of Funding
13
11
9
7
5
3
10/2011
12/2011
02/2012
04/2012
06/2012
08/2012
10/2012
12/2012
04/2013
06/2013
08/2013
10/2013
12/2013
12/2013
02/2014
04/2014
06/2014
08/2014
10/2014
12/2014
Source: CBT
CPI BY YEAR
11
10
9
8
7
6
5
4
3
2005
2006
2007
2008
2009
2010
2011
2012
2013
2014
CPI (y-y, %)
CBT Target
Source: CBRT, TÜİK
7.7
9.7
8.4
10.1
6.5
6.4
10.5
6.2
7.4
8.2