37
PART I: INTRODUCTION
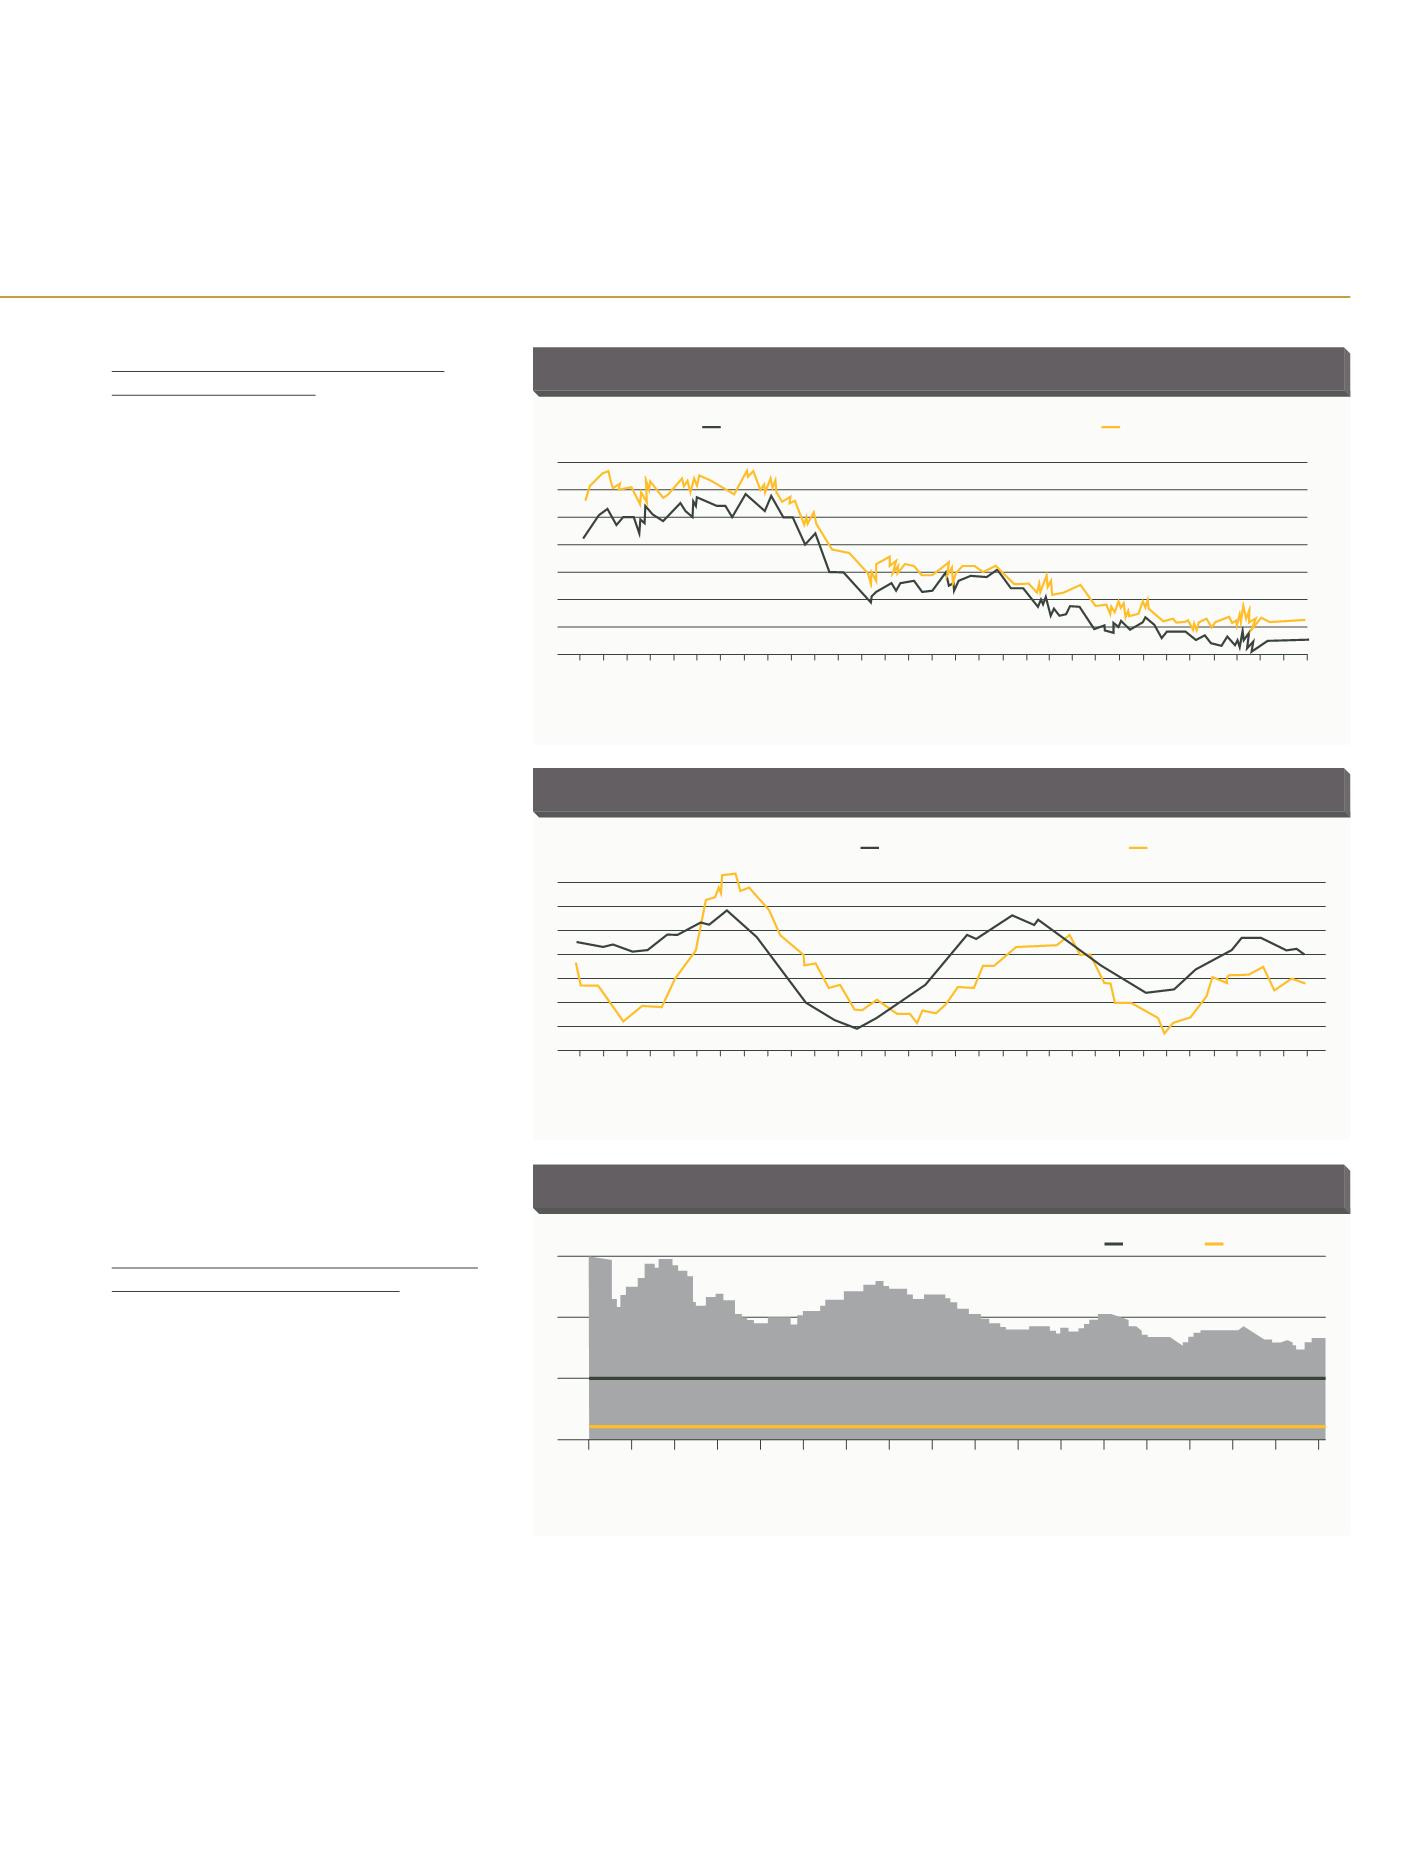
THE SHARE OF DEPOSITS IN LIABILITIES
ROSE SLIGHTLY IN 2015
Displaying a mild upward trend in the third
quarter of 2015, the share of deposits in the
funding sources of the banking sector reached
52.8% in December 2015. The growth rate of
deposits gained momentum from the beginning
of 2015 onwards and accelerated further in the
final quarter of 2015: Deposits closed the year at
an annual growth of 18.3%. An analysis of the
annual change in domestic and foreign currency
deposits reveals that both of these showed an
increase in the third quarter over the previous
quarter, however, the growth in domestic
currency deposits lost steam in the final quarter.
As in 2014, most deposits were had short
maturity terms. The weight of deposits with a
maturity term of 1 to 3 months in total deposits
went up from 53.72% in December 2014 to
54.82% in December 2015.
Non-deposit sources (NDS), considered to
be the alternative financing means of the
banking sector, gained further importance
owing to the rise in overall funding costs.
After exhibiting in August 2015 its largest
increase since April 2014, the NDS lost some
steam in december, and on the whole, rose
19.7% the year-on-year to reach TL 849.8
billion. During the same period, the weight
of NDS in total liabilities stood at 36%.
Shareholders’ equity, whose annual growth
rate dropped from year-end 2014 until July
2015, stood at 13% in december. The share
of shareholders’ equity in total liabilities was
11% in the said month.
PROFITABILITY RECOVERED IN 2015 AFTER
THE DROP IN THE PREVIOUS YEAR
The sector’s annual net profit, after dropping in
the first half of 2014, tilted upwards in 2015 in
part due to the base effect, and reached 5.9%
on an annual basis despite another slowdown
in the third quarter of 2015. As a result, the net
profit for the period stood at TL 26.1 billion as of
december. The rise in net interest income was
key to this increase in profitability. Net interest
revenue soared by 18% in december on annual
basis to hit TL 77.3 billion. Profitability ratios
continued their trends in 2014. The sector’s RoA
declined to 1.11%, from 1.23% in 2014, while
RoE declined to 9.94%, from 10.6% in 2014.
The capital adequacy ratio, which shows the ratio
of the sector’s capital to its risk-bearing assets, is
above the legal limit of 8% and the target ratio
of 12%; nevertheless, exhibited a downtrend
in 2015 and tilted upward only from october
onwards. As such, the capital adequacy ratio
dropped from 16.28% in 2014 to 15.6% in 2015.
The fact that the capital adequacy ratio has been
falling since the first quarter suggests that the
banks need to further expand their shareholders’
equity to meet their risk-bearing assets.
The Fed’s decision in December 2015 to raise
its policy rate has eliminated a significant
uncertainty factor. Furthermore, it was
announced that rate rises would continue
gradually in 2016. This announcement has
lessened the pressure on interest rates and
exchange rate. In 2015, the rise in the exchange
rate played a crucial role in the rapid loan and
asset growth of the banking industry. In 2016,
however, the annual growth rate of loans and
assets is expected to decelerate to a certain
degree.
NET PROFIT AND NET INTEREST INCOME
50
40
30
20
10
0
-10
-20
June 08
Sept 08
Dec 08
Marc 09
June 09
Sept 09
Dec 09
Marc 10
June 10
Sept 10
Dec 10
Marc 11
June 11
Sept 11
Dec 11
Marc 12
June 12
Sept 12
June 13
Dec 12
Marc 13
June 13
Sept 13
Dec 13
Marc 14
June 14
Sept 14
Dec 14
Marc 15
June 15
Sept 15
Dec 15
Source: BRSA
Net Interest Income (Annual % change)
Net Profit (Annual % change)
CAPITAL ADEQUACY RATIO
(CAR)
22
17
12
7
Target Rate Legal Boundaries
Source: BRSA
Jan 06
August 06
Marc 07
Oct 07
May.08
Dec 08
July 09
Feb 10
Sept 10
Apr 11
Nov 11
June 12
Jan 13
August 13
Marc 14
Oct 14
May.15
Dec 15
SHARE OF DEPOSITS IN LIABILITIES
64
20
62
60
58
56
54
52
50
38
36
34
32
30
28
26
24
22
June 08
Sept 08
Dec 08
Marc 09
June 09
Sept 09
Dec 09
Marc 10
June 10
Sept 10
Dec 10
Marc 11
June 11
Sept 11
Dec 11
Marc 12
June 12
Sept 12
June 13
Dec 12
Marc 13
June 13
Sept 13
Dec 13
Marc 14
June 14
Sept 14
Dec 14
Marc 15
June 15
Sept 15
Dec 15
Source: BRSA
Share of non-Deposits in Liabilities (%) (Right, Opposite Axis)
Share of Deposits in Liabilities (%)


